

We are often reminded that both wealth inequality and real income inequality have remained remarkably stable in the UK have over the past 30 years. While both forms of inequality increased sharply in the 1980s and are significantly higher in the UK than in many other advanced economies, neither are anywhere near as extreme as the levels of inequality seen in the United States.
How, then, can we make sense of the claims made by economists and campaigners that inequality has soared since the global financial crisis, and rocketed since the Covid pandemic? And why do so many of us get the distinct impression that the system is unfair and rigged in favour of the super-rich?
One explanation for the persistence and prevalence of perceptions of unfairness and rising inequality in the UK is that wealth has become so much more important relative to income. Household wealth has almost doubled relative to GDP since 1991, rising from about three and a half times as large to seven times as large. Consequently, while the mean wealth of someone in the 5th wealth decile went from around £93,000 to £111,000 in the ten years after 2006–08, the gap between the mean wealth of the 5th and 9th wealth deciles grew from around £299,000 to £430,000.
If the significance of these figures isn’t immediately obvious, then think of it like this: while the mean wealth of the 5th decile grew by two-thirds of a typical full-time salary over the decade after 2006–08, the mean wealth of the 9th wealth decile grew by 5.4 times, and the mean wealth of the 10th wealth decile by 8.9 times a typical full-time salary. This means that the gap between the 5th and 9th deciles has increased from 10 years to almost 16 years of typical full-time earnings.
Still struggling to see the wood for the trees? Then take a look at the following chart from a report published by the Fairness Foundation, which provides a useful visual illustration of what has been happening:
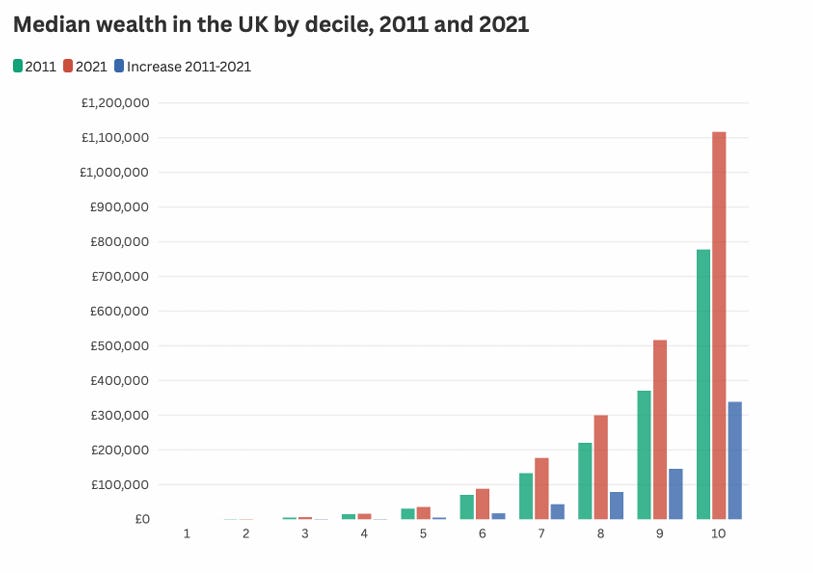
Source: Jeffrey et al., 2025, Wealth Gap Risk Register, Fairness Foundation.
Notice that the relative distance between the green bars (representing median wealth for each decile in 2011) is roughly the same as the relative distance between the red bars (representing median wealth for each decile in 2021). This indicates that relative inequality was fairly stable between 2011 and 2021. But the absolute gap between deciles is much larger in 2021 than in 2011, indicating that absolute inequality has grown sharply — the financial distance between the middle and the top has stretched even if their relative positions in the distribution haven’t changed.
This difference in wealth between rich and poor households is known as the ‘wealth gap’. The rich and the poor may occupy the same rungs of the ladder, but the rungs are now much farther apart.
The wealth gap is both a symptom and a driver of many of the social and economic problems currently facing the people of Britain, from generational inequality, rising unemployment and the ongoing housing crisis, to slow growth, failing public services, and the ballooning public debt. As wealth becomes relatively more important than household income and GDP, social mobility is undermined, and exclusion and precarity become ever more normalised. Wealth now matters far more than income in determining life chances.
The prospect of working one’s way up from the bottom of the wealth distribution - a realistic possibility for many people 20 years ago - has become an impossible dream for a growing share of the population.
How did we get here? How exactly is the wealth gap shaping our economic and social landscape? And what can be done to reverse it? These are some of the questions this Substack will explore in the months ahead. If you want to understand the forces shaping Britain — and what a fairer and more efficient system might look like — stay tuned.