

The previous Empirical Insights post highlighted the growing importance of wealth relative to income, pointing out that although relative inequality has remained stable in the UK over the past several decades, the growth of the wealth gap has undermined social mobility and normalised exclusion and precarity. This post focuses on a different aspect of the problem of inequality – the uneven distribution of economic prosperity, opportunities, and living conditions across the different geographic areas within the UK.
Although regional inequality is a problem that has affected all industrialised nations since the 1980s, it is especially severe and entrenched in the UK. Per capita gross value added (GVA) in London is around 80% higher than the UK average, and two-and-a-half times that in the North East, the region with the lowest GVA per capita. The productivity disparity (measured by gross value added per worker and gross domestic product per capita) between London and the South East versus the rest of the UK is now larger than the productivity gap between East and West Germany, or North and South Italy.
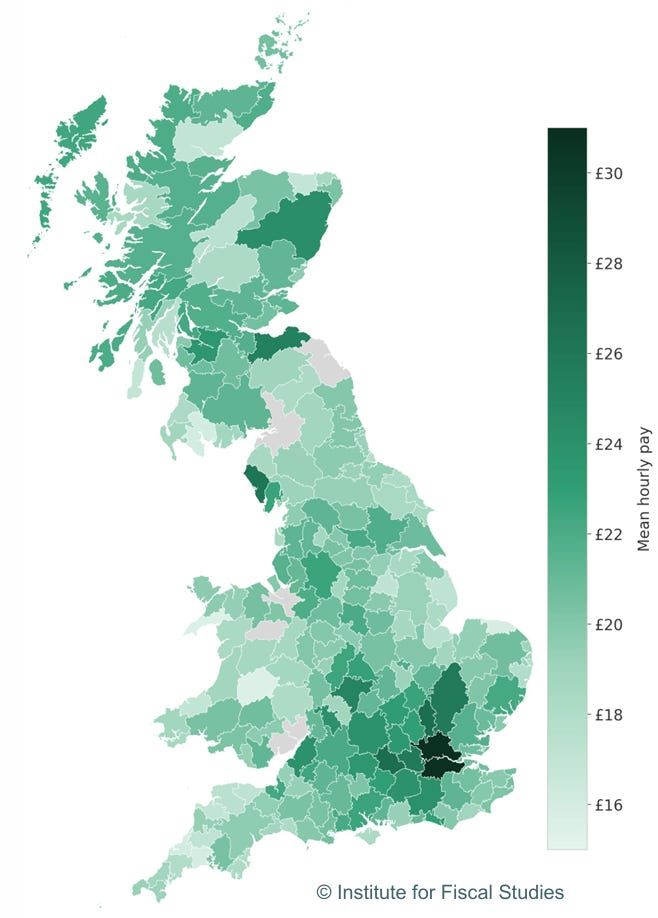
This vast productivity disparity within the UK helps to explain why average hourly wages in London are around twice as high as average hourly wages in the lowest-paid areas of the country, and 35-40% higher than in Manchester and Birmingham. It is almost as if London is an entirely different country from the rest of the UK, separated by a gulf of economic opportunity that no amount of commuting can realistically bridge.
Average hourly wage by travel to work area (TTWA), 2025
Source: ONS, Xiaowei Xu, 2026, Geographical inequalities
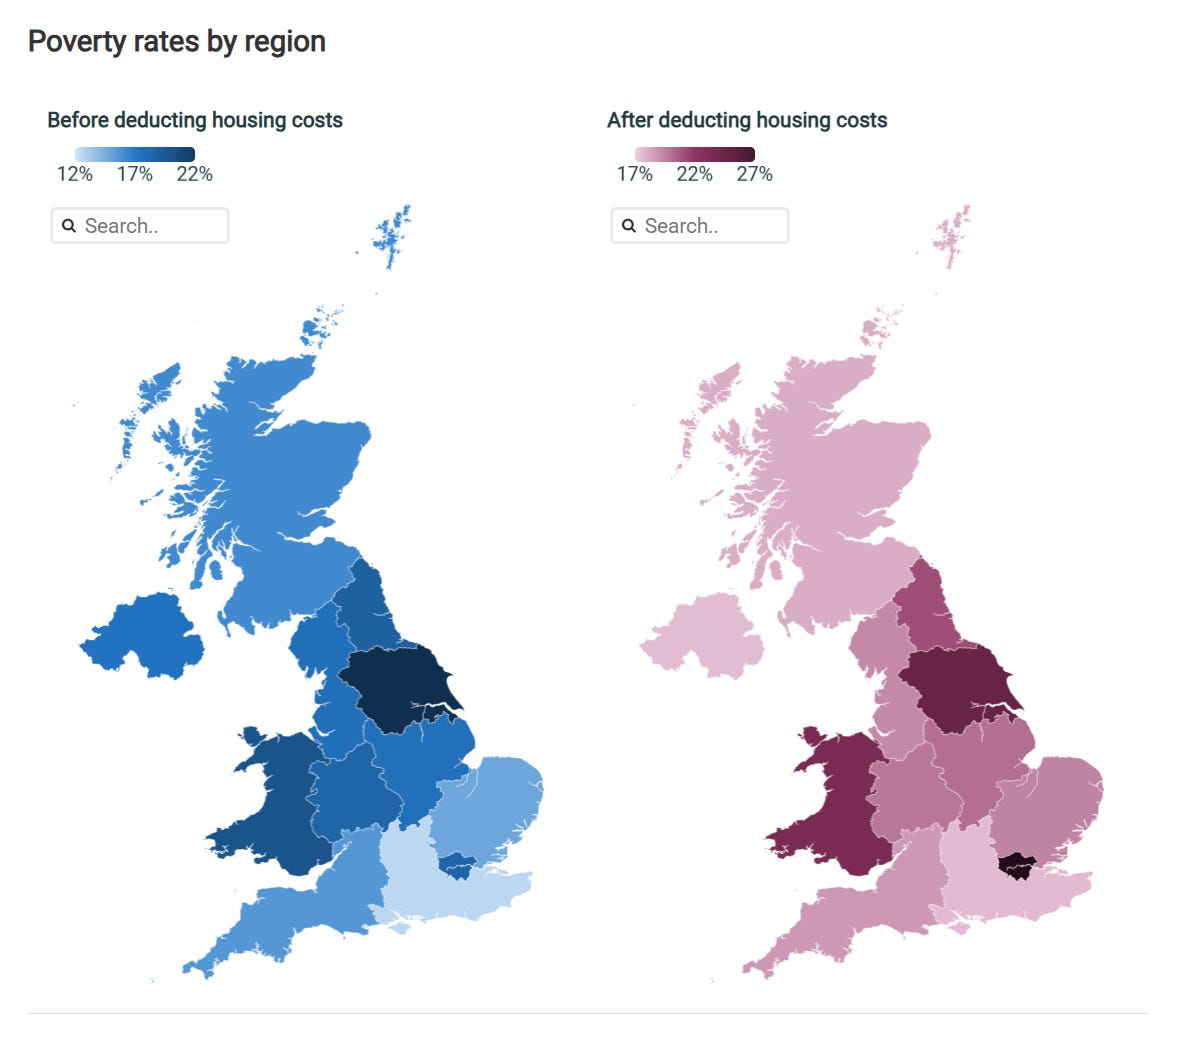
Yet the reality is that this apparent country-within-a-country contains chasms of inequality every bit as deep as those dividing London from the rest of Britain. In the late 2010s, London’s poverty rate was around 16% before housing costs but rose to 27% once rent and mortgages were taken into account—roughly the same level as the West Midlands or the North East. The latest Family Resources Survey (2022–23) shows the pattern persisting, with London’s poverty rate at 19% before housing costs (BHC) and 29% after housing costs (AHC). London is, in other words, both one of the richest and one of the poorest places in Britain at the same time.
Source: ONS, Living standards, poverty and inequality in the UK | Institute for Fiscal Studies
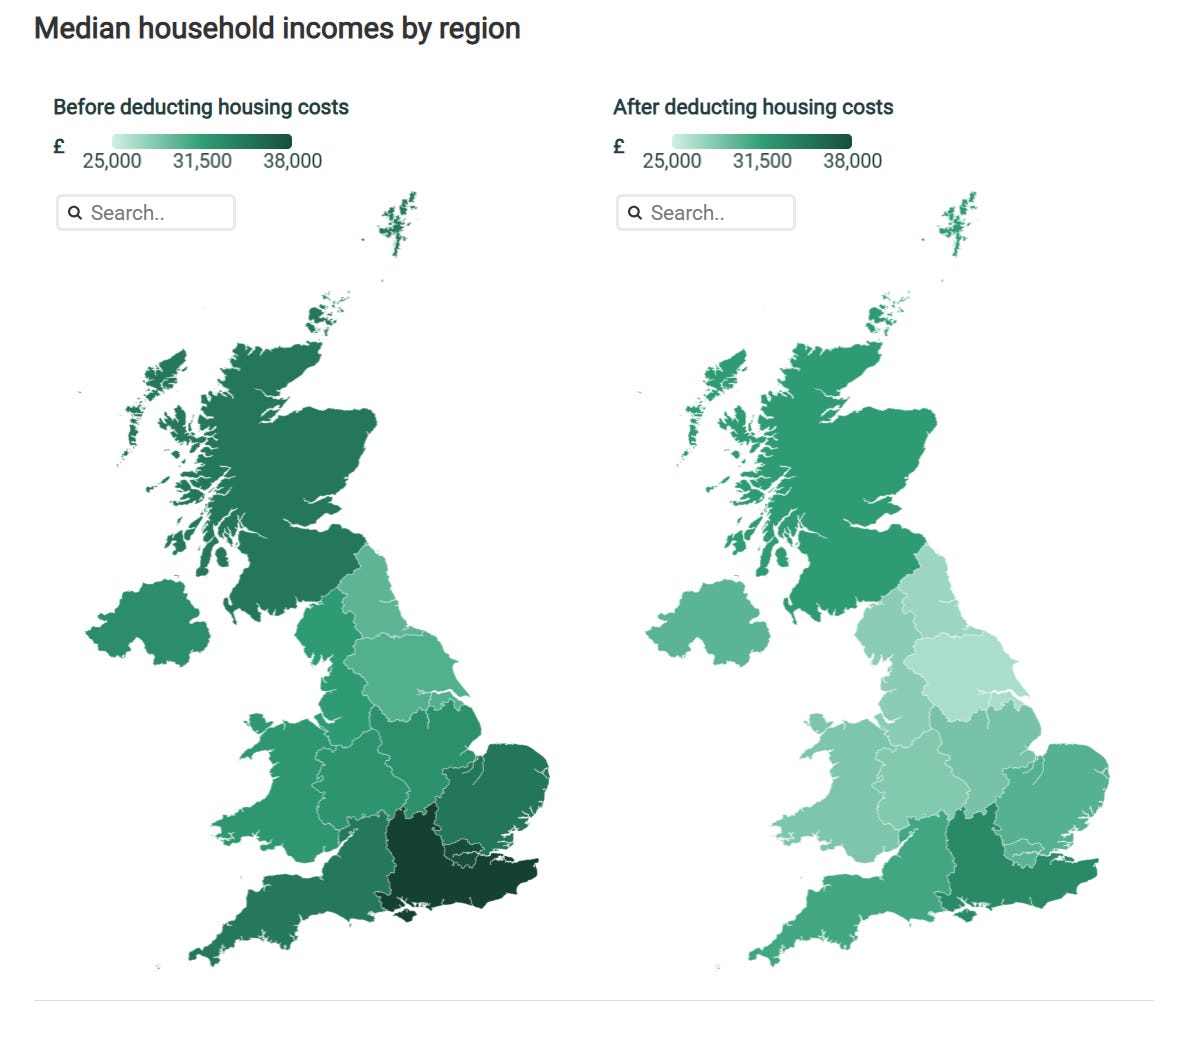
Because housing costs absorb a disproportionate share of disposable income, London’s high wages do not translate into low poverty. In effect, London resembles a high‑income region on a BHC basis but a high‑poverty region on an AHC basis, underscoring the importance of housing costs in understanding regional living standards. Once housing costs are factored in, London’s median income falls back toward the national norm, revealing how little of its headline prosperity reaches typical households.
Source: ONS, Living standards, poverty and inequality in the UK | Institute for Fiscal Studies
The sheer scale of the geographic economic and social inequalities that exist across the UK - not just between London and the rest of the country, but also within London itself – has given rise to a ‘geography of discontent’, fuelling a growing sense of grievance in the places left furthest behind. Economic frustration, political alienation, and social resentment have become concentrated in towns, regions, and local labour markets marked by long‑term economic decline, weak job prospects, poor public services, and persistent social stagnation.
These geographic inequalities and disparities are simply the wealth gap written onto the landscape — a spatial pattern of advantage and exclusion, and one of the main ways the wealth gap has become visible, persistent, and politically consequential.
Subsequent Empirical Insights posts will highlight regional disparities in important outcomes like health, life expectancy, educational attainment, and social mobility. The next EI post will start to identify some of the key drivers of the growth of the wealth gap, focusing initially on the following simple question: What has been the fastest growing source of wealth over the past 10-15 years? If you think you already have an idea what the answer might be, feel free to share your thoughts in the comments.
Great post, excellent analysis, and a surprising yet perhaps logical conclusion. Not even London is the promised land.
Evidence from around the world accumulates daily. The situation of people with below-median incomes is steadily worsening.
There are two paths – reforming national tax and transfer systems, which requires political consensus that rarely arrives.
Or harnessing the Klondike effect at county level – retaining wealth locally would lift the region, and every person in it.